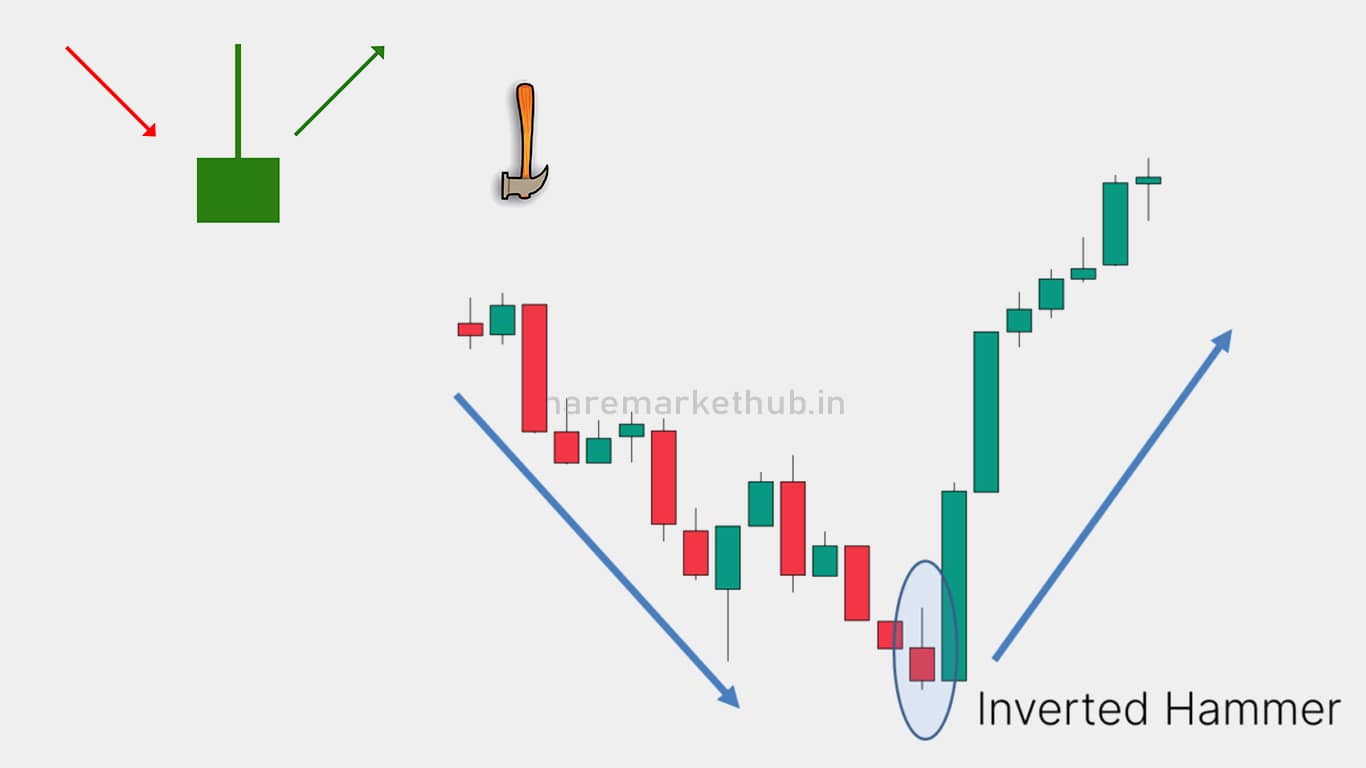
📌 Chart Me Inverted Hammer Kaise Dikhta Hai?
Inverted Hammer ek single-candle bullish reversal pattern hai jo chart par tab dikhta hai jab:
- Market downtrend me hota hai 📉
- Ek candle banti hai jisme:
- Small body niche hoti hai
- Upper wick (shadow) bahut lambi hoti hai
- Lower wick chhoti ya nahi hoti
👉 Chart par yeh aisa lagta hai:
Price upar shoot hua tha, par close niche ke paas hua — buyers ki entry ka signal 📈
🧠 Chart Me Iska Meaning
Jab aap chart me Inverted Hammer dekhte ho:
- Sellers weak ho rahe hai 😴
- Buyers market me interest dikhane lage hai 🔥
- Trend reverse ho sakta hai
👉 Simple:
“Downtrend ruk raha hai, bullish move aa sakta hai”
🔍 Real Chart Behavior (Important)
Chart me Inverted Hammer tab powerful hota hai jab:
- Strong downtrend ke baad aaye
- Support level ke paas bane
- Upper wick kaafi long ho (rejection dikhata hai)
👉 Important Rule:
Upper shadow body se 2x ya zyada lambi honi chahiye
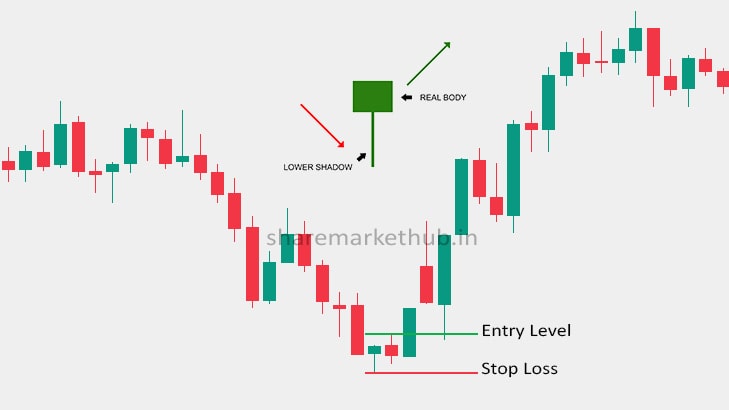
📈 Trading Setup (Chart Based)
✅ Buy / Long Entry
- Inverted Hammer downtrend ke baad bane
- Next candle bullish close kare (confirmation)
👉 Tab buy / long trade le sakte ho
🎯 Stop Loss & Target
- Stop Loss → Candle ke low ke niche
- Target → Next resistance / 1:2 ya 1:3 RR
⚠️ Chart Me Kab Ignore Kare?
- Uptrend me (waha yeh Shooting Star ban jata hai)
- Sideways market me
- Confirmation candle na mile
⚠️ Common Mistakes
- ❌ Shooting Star ke saath confusion
- ❌ Direct entry lena without confirmation
- ❌ Support level ignore karna
👉 Always combine with:
- Support zone
- Volume
- Trend confirmation
💡 Pro Tips (Chart Reading)
- Long upper wick = buyer interest ka signal 🔥
- High volume ke sath aaye → pattern strong hota hai
- Higher timeframe (1H, 4H, Daily) me best results
🆚 Inverted Hammer vs Shooting Star (Chart)
| Pattern | Signal | Trend |
|---|---|---|
| Inverted Hammer | Bullish | Downtrend ke baad |
| Shooting Star | Bearish | Uptrend ke baad |
🚀 Conclusion
Chart me Inverted Hammer ek early bullish reversal signal hai:
👉 Market me buyers entry le rahe hai
👉 Downtrend reverse ho sakta hai
⚠️ Lekin:
Confirmation ke bina trade lena risky hai
🎁 Start Your Trading Journey (Recommended Platforms)
👉 Trading start karne ke liye trusted platforms use karo:
- 🔹 Delta Exchange (Crypto Futures Trading)
👉 Join karo: https://www.delta.exchange/?code=FORFYQ
👉 Use code: FORFYQ - 🔹 Dhan (Stocks & Trading)
👉 Account open karo: https://join.dhan.co/?invite=CTZHS34705 - 🔹 CoinDCX (Crypto Trading)
👉 Signup karo: https://invite.coindcx.com/95631964
📢 Final Note
Agar aapko aise hi chart reading aur candlestick mastery seekhni hai:
👉 Visit karo: https://www.sharemarkethub.in/
👉 Aur apne dosto ke saath share karo 🚀