📌 Falling Wedge Kya Hota Hai?
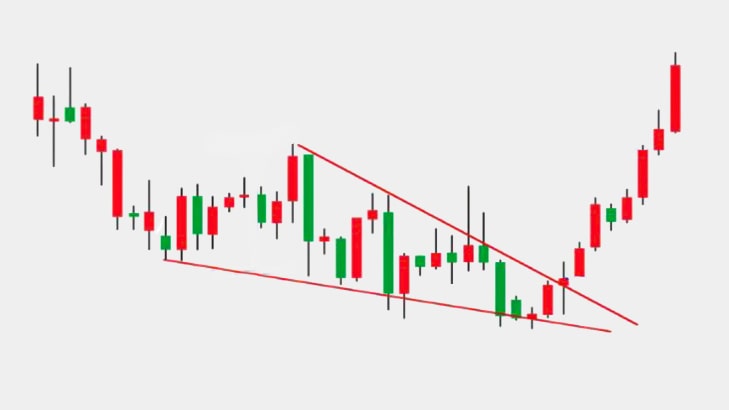
Falling Wedge ek bullish chart pattern hai jo mostly downtrend ke end par banta hai.
👉 Is pattern me:
- Price lower highs + lower lows banata hai
- Lekin range dheere dheere narrow (compress) hoti jati hai
👉 Simple language me:
Market niche ja raha hai, lekin selling weak ho rahi hai… aur breakout upar ho sakta hai 📈🔥
🧠 Pattern Ka Meaning
Ye pattern batata hai:
- Sellers ka pressure kam ho raha hai 😴
- Buyers dheere dheere strong ho rahe hai
- Trend reverse ho sakta hai (bearish → bullish)
👉 Simple:
“Downtrend khatam hone wala hai, breakout aa sakta hai”

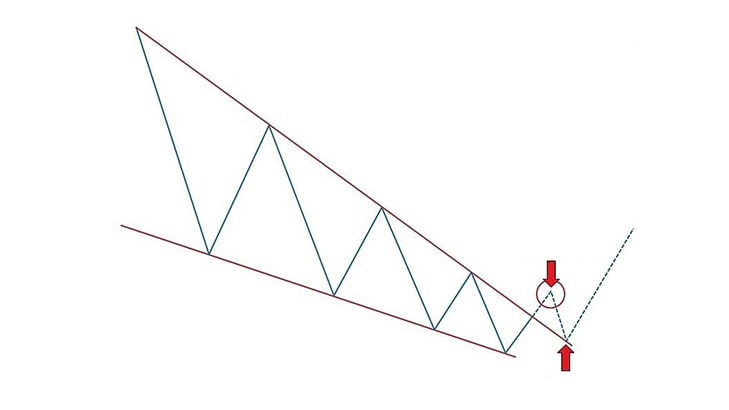
🔍 Structure Samajh Lo
- Upper trendline → Lower highs
- Lower trendline → Lower lows
- Dono lines converge (triangle jaisa shape)
👉 Phir:
Breakout (upper trendline ke upar)
📈 Trading Setup
✅ Buy / Breakout Entry
- Falling Wedge ke upar clean breakout ho
- Candle close resistance ke upar ho
👉 Tab buy / long trade le sakte ho
🎯 Stop Loss & Target
- Stop Loss → Pattern ke last low ke niche
- Target → Wedge ki height ke equal upside
👉 (Measured move technique)
⚠️ Kab Avoid Kare?
- Weak trend me
- Fake breakout ho raha ho
- Low volume me
⚠️ Common Mistakes
- ❌ Early entry lena (breakout se pehle)
- ❌ Wedge ko triangle samajhna
- ❌ Volume ignore karna
👉 Always combine with:
- Volume spike
- Trend confirmation
- Support/Resistance
💡 Pro Tips (Advanced Traders)
- Breakout ke time high volume = strong signal 🔥
- Retest ke baad entry lena safe hota hai
- Higher timeframe (1H, 4H, Daily) me jyada reliable
🆚 Falling Wedge vs Rising Wedge
| Pattern | Signal | Trend |
|---|---|---|
| Falling Wedge | Bullish | Downtrend ke baad |
| Rising Wedge | Bearish | Uptrend ke baad |
🚀 Conclusion
Falling Wedge ek powerful bullish reversal pattern hai:
👉 Market me selling pressure weak ho raha hai
👉 Breakout ke baad strong rally aa sakti hai
⚠️ Lekin:
Confirmation ke bina trade lena risky hai
🎁 Start Your Trading Journey (Recommended Platforms)
👉 Trading start karne ke liye trusted platforms use karo:
- 🔹 Delta Exchange (Crypto Futures Trading)
👉 Join karo: https://www.delta.exchange/?code=FORFYQ
👉 Use code: FORFYQ - 🔹 Dhan (Stocks & Trading)
👉 Account open karo: https://join.dhan.co/?invite=CTZHS34705 - 🔹 CoinDCX (Crypto Trading)
👉 Signup karo: https://invite.coindcx.com/95631964
📢 Final Note
Agar aapko aise hi chart patterns + price action mastery seekhni hai:
👉 Visit karo: https://www.sharemarkethub.in/
👉 Aur apne dosto ke saath share karo 🚀