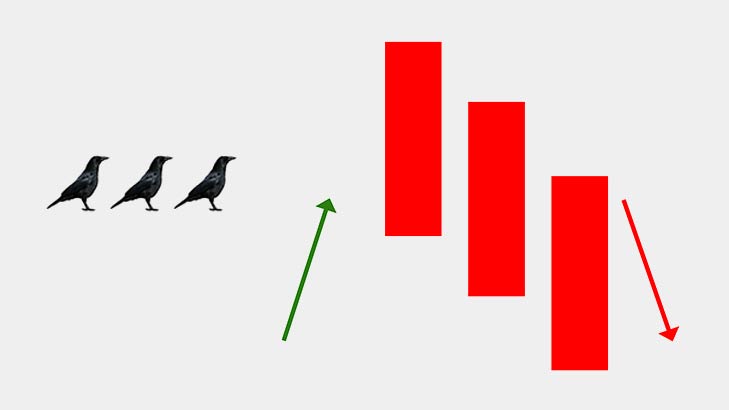
Three Black Crows Candlestick In Share Market
Three Black Crows The three black crows pattern, which consists of multiple candles and appears at the peak of an […]
Three Black Crows The three black crows pattern, which consists of multiple candles and appears at the peak of an […]
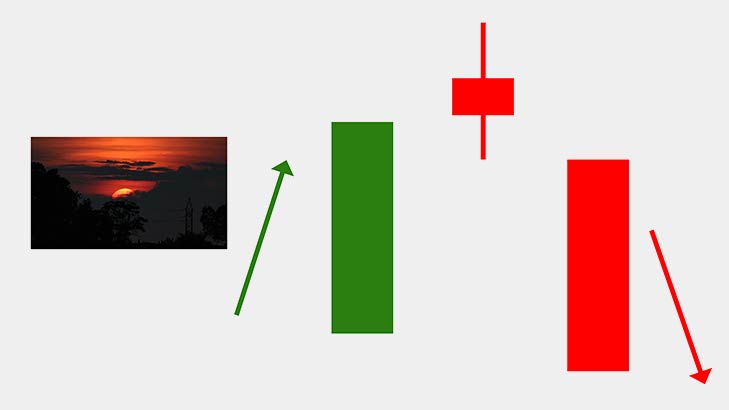
The Evening Star The multiple candlestick pattern known as the evening star appears at the peak of an uptrend and
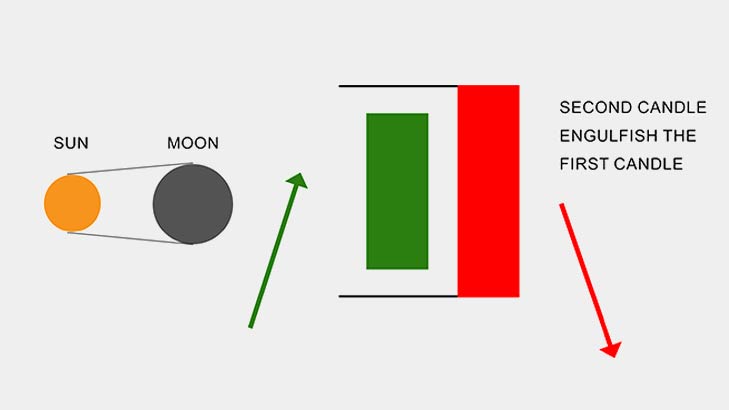
Bearish Engulifing A two-candlestick pattern known as a bearish engulfing pattern, which appears at the peak of an uptrend and
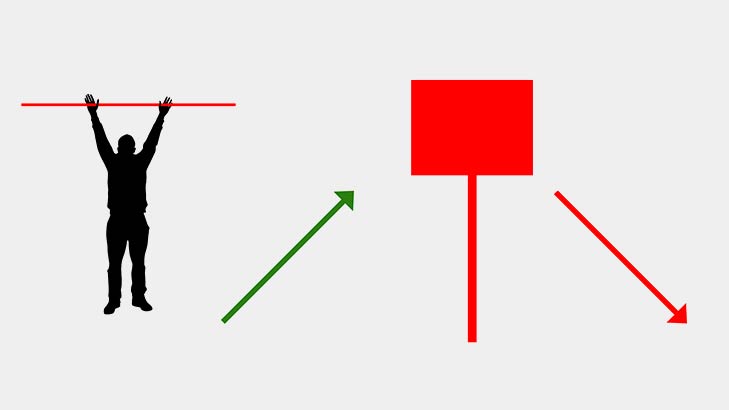
Hanging Man Pattern When an Uptrend comes to an end, a hanging man pattern appears, Indicates a bearish reversal. The
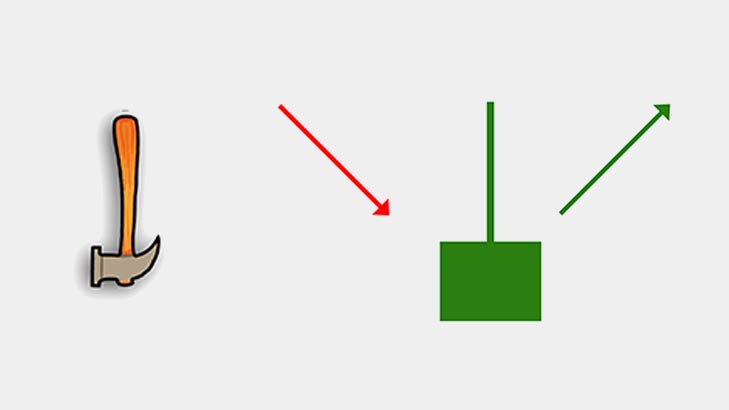
Inverted Hammer The inverted hammer pattern, which is the opposite of the hammer patterns, occurs at the end of a
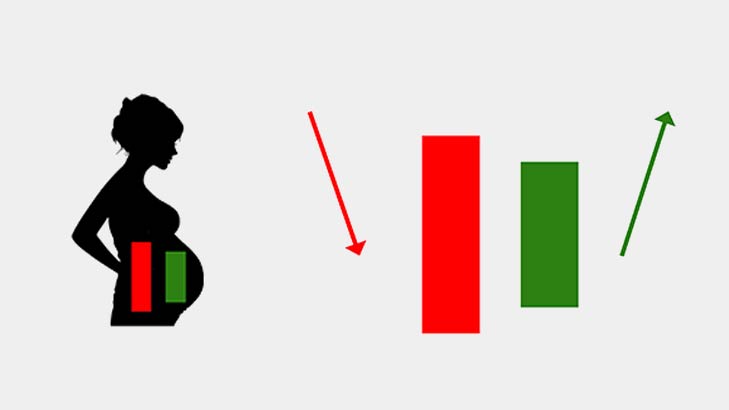
Bullish Harami The bullish harami pattern is a two candlestick chart pattern that shows a bullish reversal when it appears
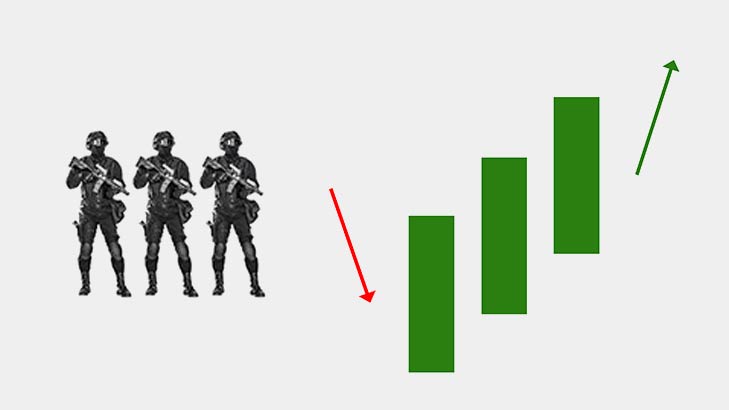
Three White Soldiers A three-candlestick chart pattern known as the “three white soldiers” appears during a downtrend and indicates a
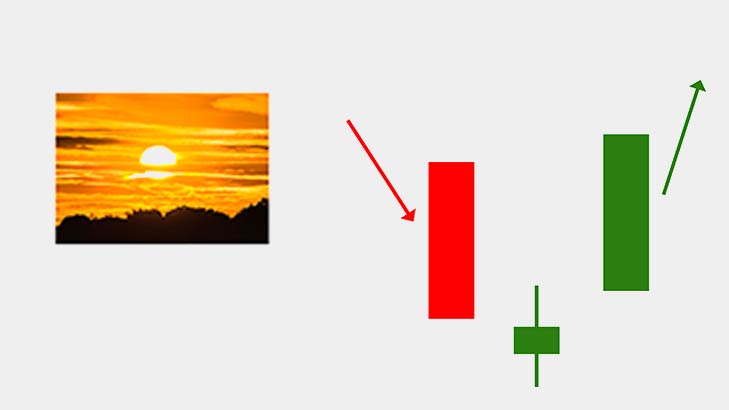
Morning Star The morning star pattern is a three candlestick chart pattern that shows a bullish reversal when it appears
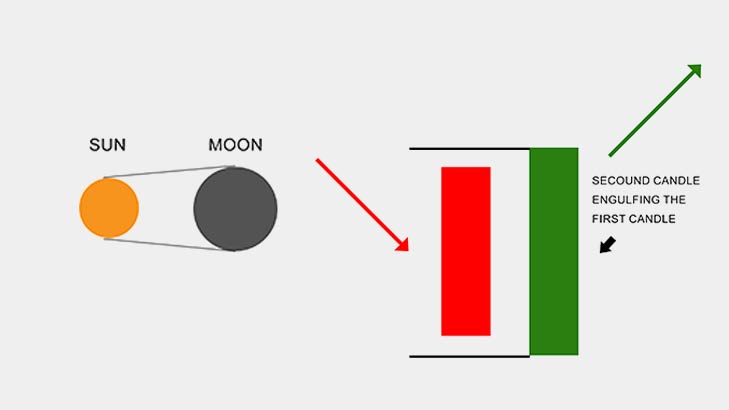
Bullish Engulfing Bullish engulfing is a two-candlestick chart pattern that appears during a downtrend and indicates a bullish reversal. The
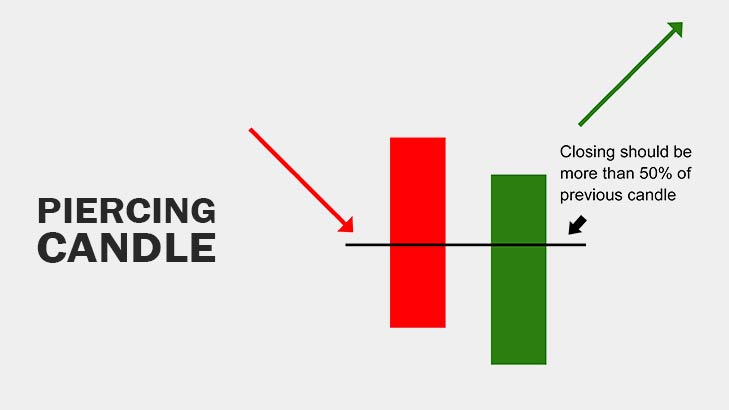
Piercing Pattern A two-candlestick chart pattern called a “piercing pattern” that appears during a downtrend signals a bullish reversal. First
