
Market Analysis For 6-May-24
NIFTY Prediction NIFTY (22,476) Nifty is currently in positive trend. If you are holding long positions then continue to hold […]
NIFTY Prediction NIFTY (22,476) Nifty is currently in positive trend. If you are holding long positions then continue to hold […]

The inverted Cup and Handle chart pattern is essentially the opposite of the traditional Cup and Handle pattern. While the
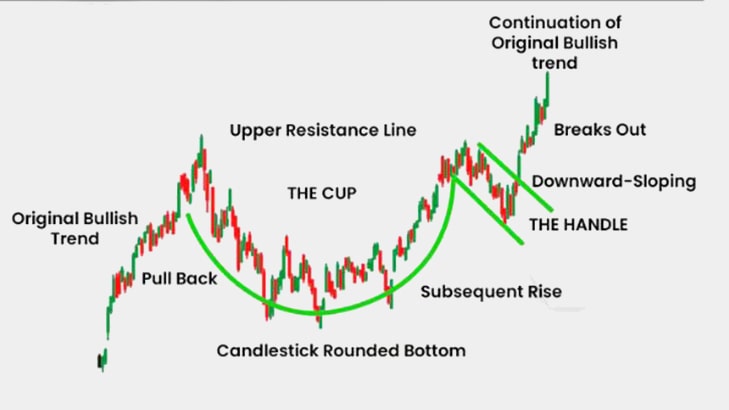
The Cup and Handle chart pattern is a bullish continuation pattern that can indicate a potential upward trend continuation after

The bearish symmetrical triangle chart pattern is a technical analysis pattern that typically forms within financial markets, signaling a potential
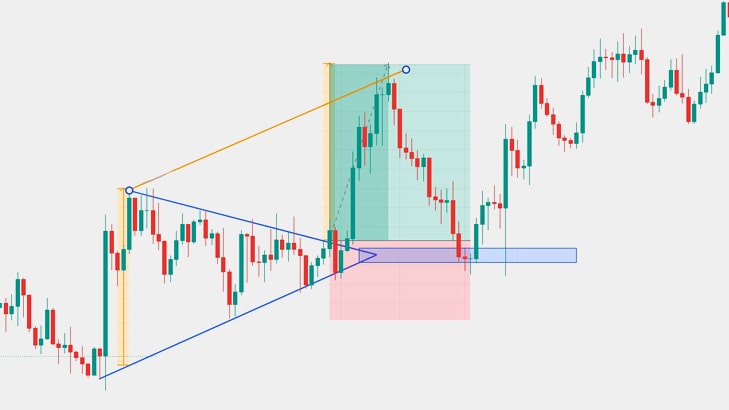
The bullish symmetrical triangle chart pattern is a technical analysis pattern that typically forms within financial markets, signaling a potential
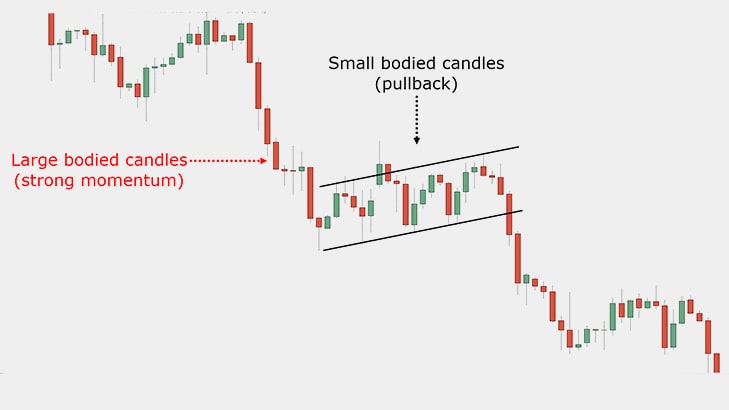
The bearish flag chart pattern is a technical analysis pattern that typically forms after a significant downward price movement in
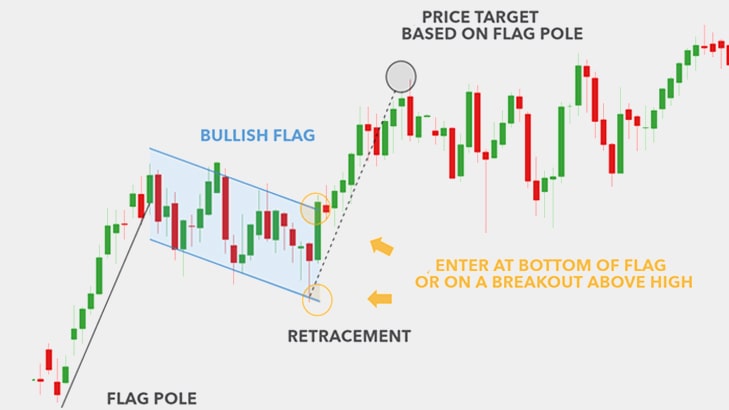
The bullish flag chart pattern is a continuation pattern observed in technical analysis, indicating a temporary pause in an uptrend
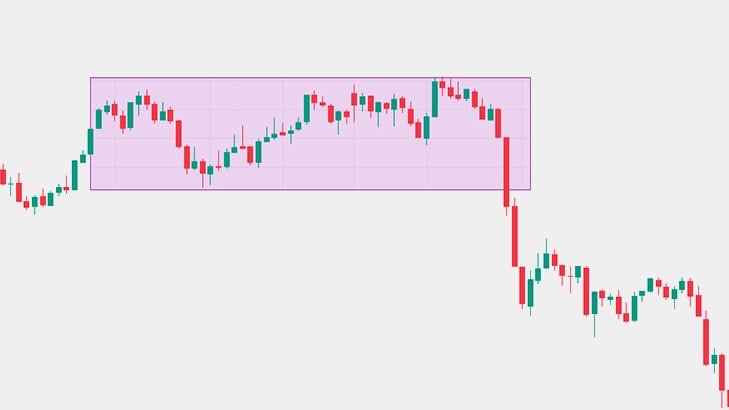
A bearish rectangle chart pattern is a technical analysis pattern observed in financial markets, particularly in stock trading. It’s characterized
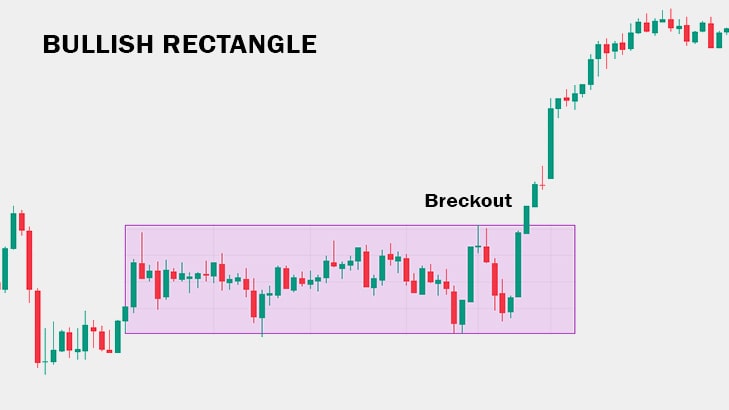
The bullish rectangle chart pattern is a continuation pattern that typically forms during an uptrend, suggesting a temporary pause in
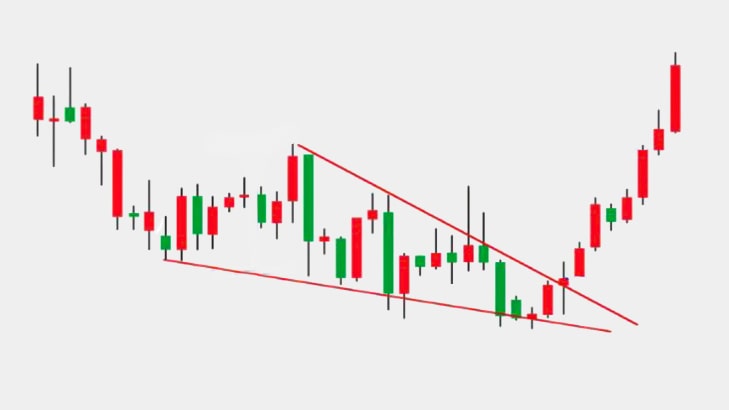
The falling wedge chart pattern is another common technical analysis pattern observed in financial markets. It’s the opposite of the
