Rising Wedge Chart Pattern
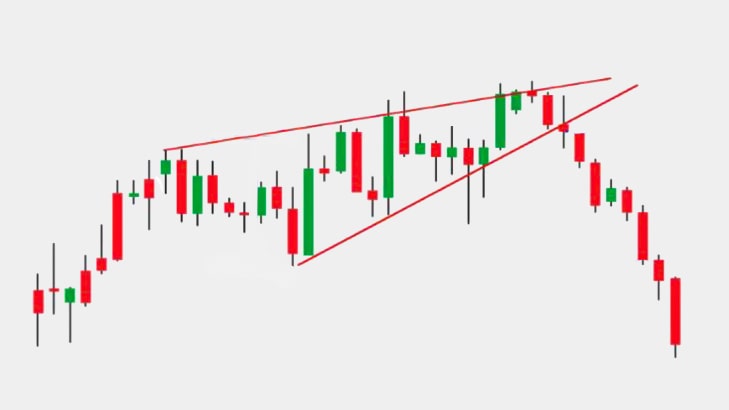
A rising wedge chart pattern is a technical analysis pattern that occurs in financial markets, particularly in stocks, forex, and […]
A rising wedge chart pattern is a technical analysis pattern that occurs in financial markets, particularly in stocks, forex, and […]

The inverse head and shoulders pattern is the bullish counterpart to the regular head and shoulders pattern. It typically forms

The head and shoulders pattern is a popular technical analysis pattern that can signal a trend reversal from bullish to

The triple bottom chart pattern is the opposite of the triple top pattern. It is a bullish reversal pattern that

The triple top chart pattern is a technical analysis pattern commonly observed in financial markets, especially in stock trading. It

The “double bottom” pattern is another common technical analysis pattern observed in financial markets, particularly in the stock market. It

A “double top” pattern is a technical analysis pattern commonly observed in financial markets, including the stock market. It typically
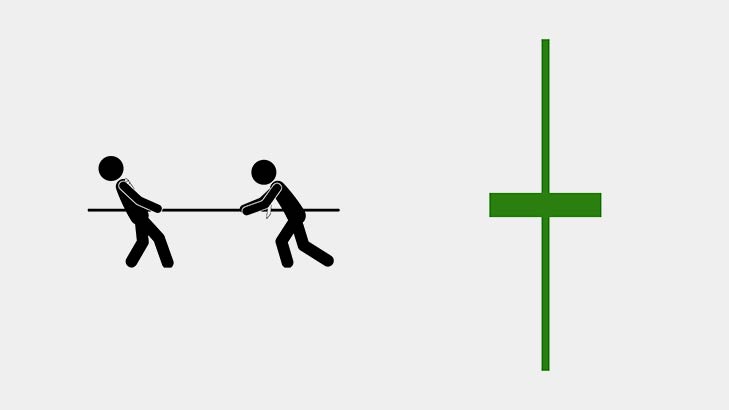
📌 Doji Candlestick Kya Hoti Hai? Doji candlestick ek indecision candle hoti hai jo market me confusion dikhati hai. Is
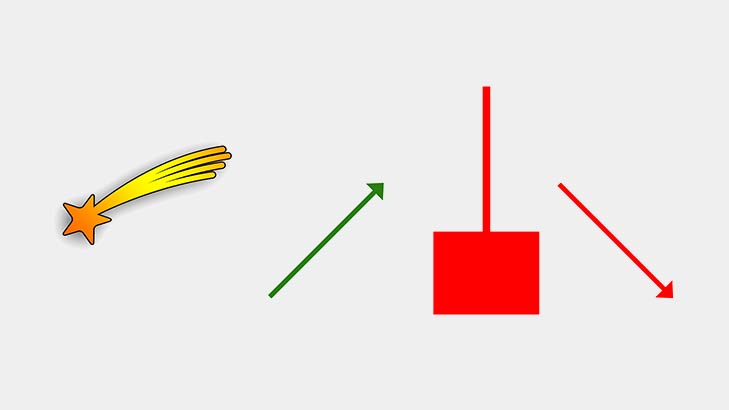
Shooting Star Pattern When a shooting star forms at the peak of an uptrend, it signals a bearish reversal. In
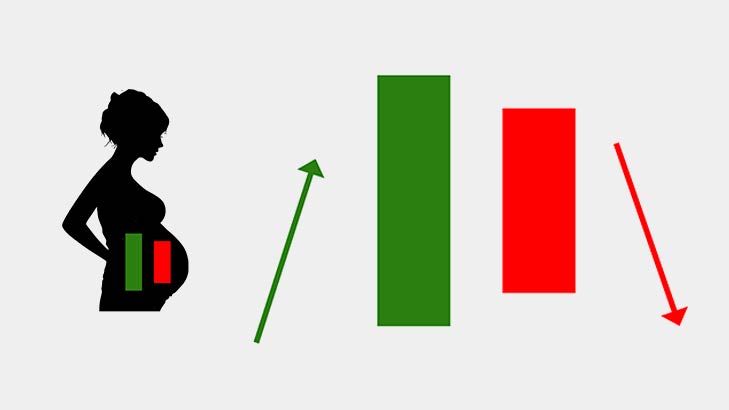
Bearish Harami A two candlestick pattern called a bearish harami, which appears after an uptrend and indicates a bearish reversal.
