Doji Candlestick Pattern Kya Hai? (Beginner to Pro Guide in Hinglish) | Doji Candle Explained
📌 Doji Candlestick Kya Hoti Hai? Doji candlestick ek indecision candle hoti hai jo market me confusion dikhati hai. Is […]
📌 Doji Candlestick Kya Hoti Hai? Doji candlestick ek indecision candle hoti hai jo market me confusion dikhati hai. Is […]
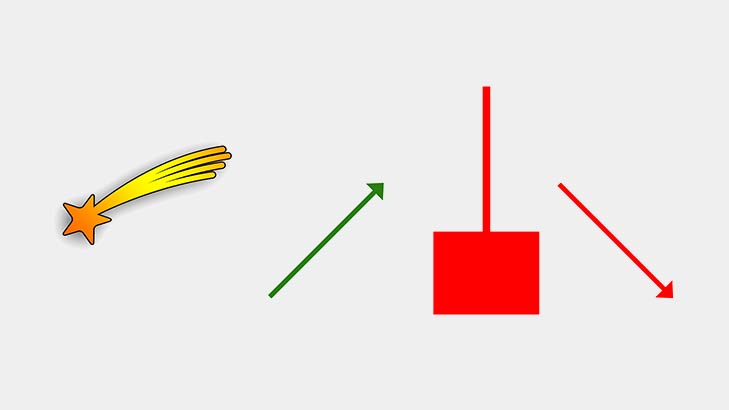
Shooting Star Pattern When a shooting star forms at the peak of an uptrend, it signals a bearish reversal. In
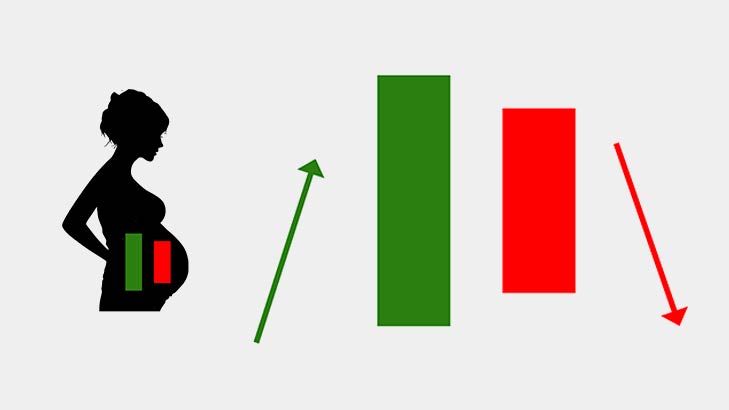
Bearish Harami A two candlestick pattern called a bearish harami, which appears after an uptrend and indicates a bearish reversal.
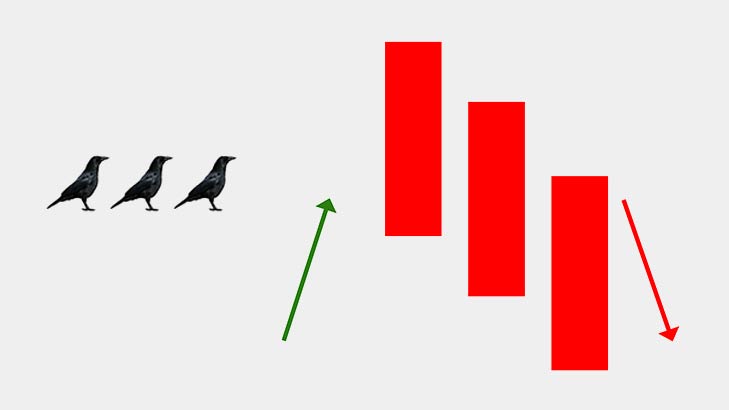
Three Black Crows The three black crows pattern, which consists of multiple candles and appears at the peak of an
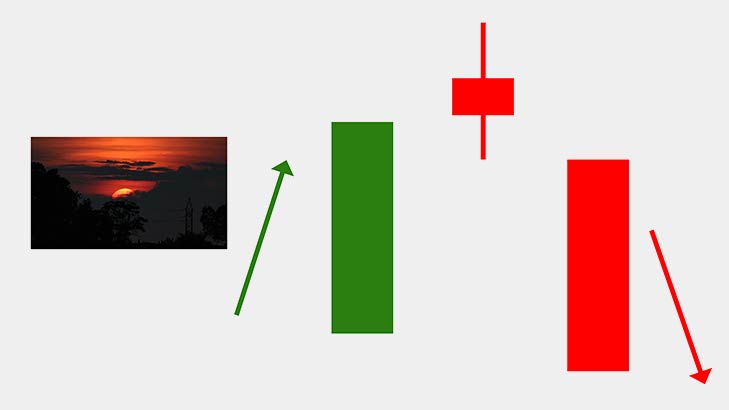
The Evening Star The multiple candlestick pattern known as the evening star appears at the peak of an uptrend and
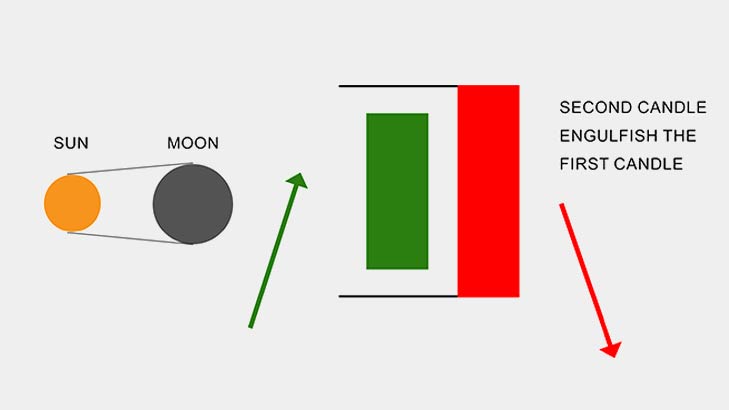
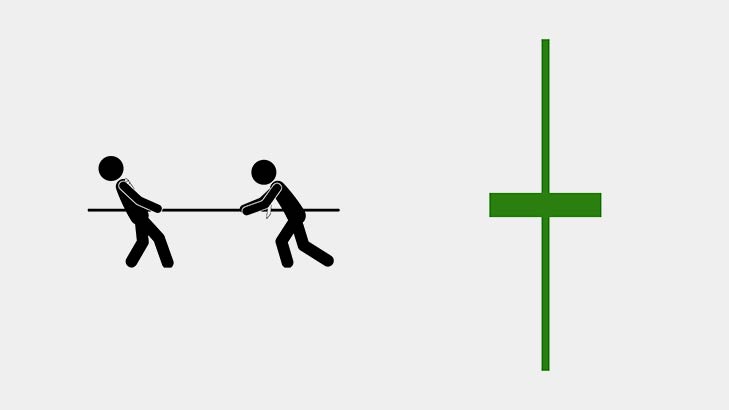
Bearish Engulifing A two-candlestick pattern known as a bearish engulfing pattern, which appears at the peak of an uptrend and
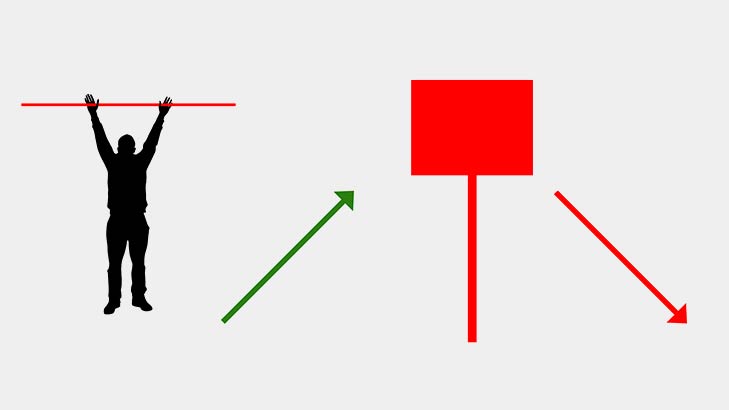
Hanging Man Pattern When an Uptrend comes to an end, a hanging man pattern appears, Indicates a bearish reversal. The
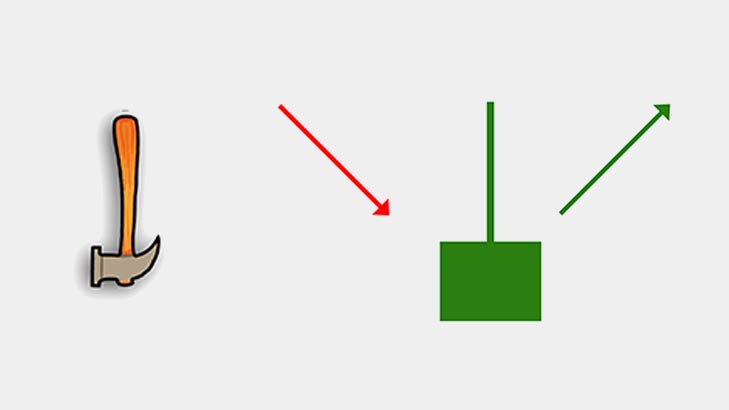
Inverted Hammer The inverted hammer pattern, which is the opposite of the hammer patterns, occurs at the end of a
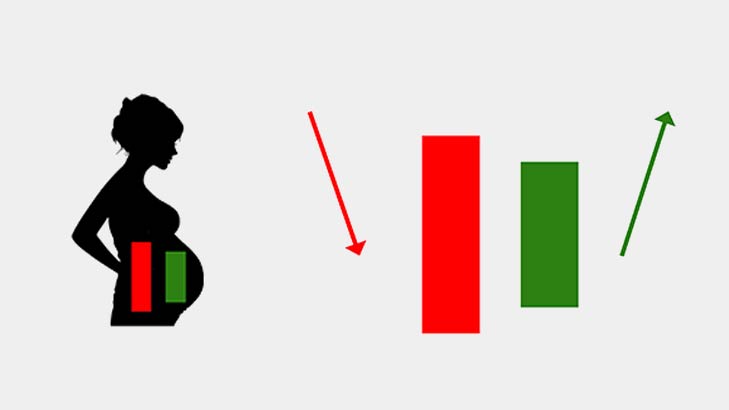
Bullish Harami The bullish harami pattern is a two candlestick chart pattern that shows a bullish reversal when it appears
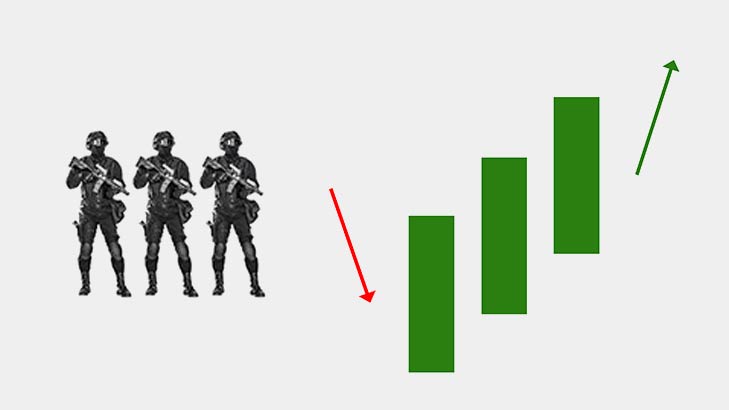
Three White Soldiers A three-candlestick chart pattern known as the “three white soldiers” appears during a downtrend and indicates a
