
Shooting Star Candlestick Pattern In Chart
A Shooting Star is a bearish candlestick pattern that often signals a potential reversal in an uptrend. This single-candle pattern […]
A Shooting Star is a bearish candlestick pattern that often signals a potential reversal in an uptrend. This single-candle pattern […]
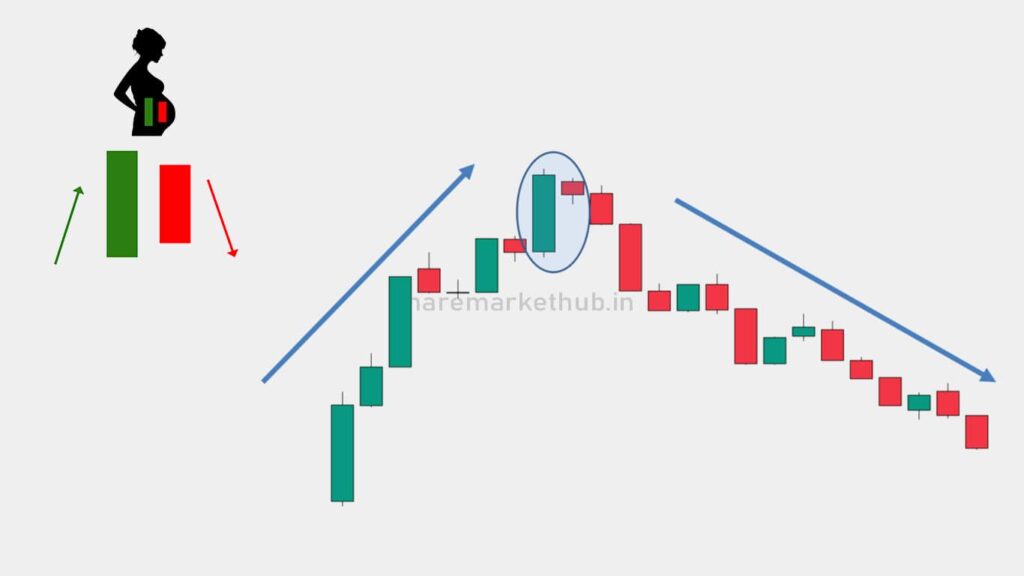
A Bearish Harami is a two-candlestick pattern found in technical analysis, typically indicating a potential reversal in an upward trend.
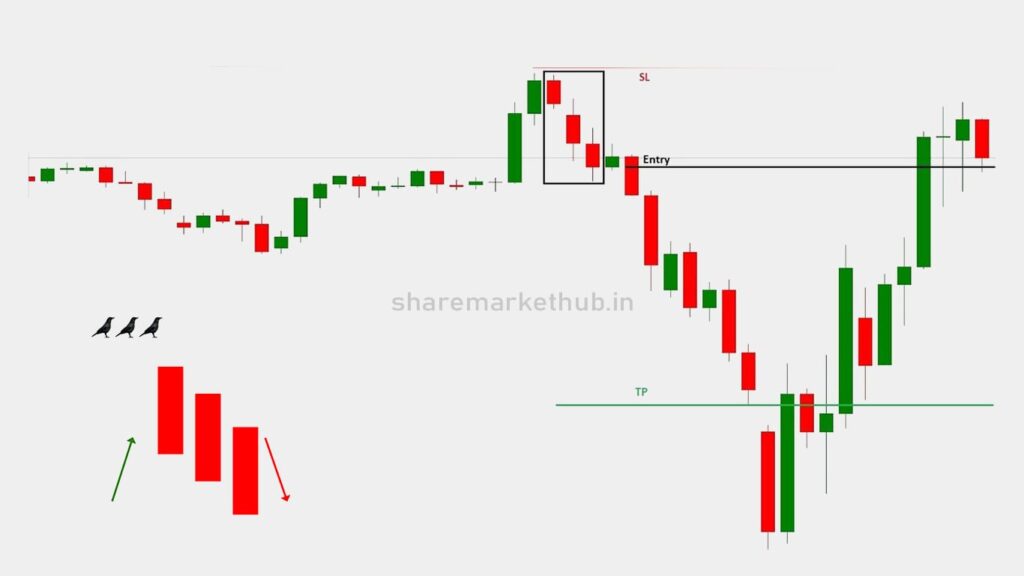
The “Three Black Crows” is a bearish candlestick pattern that can indicate a potential reversal in an uptrend. This pattern
The Evening Star candlestick pattern is a three-candle formation that technical analysts use to identify potential reversals from an uptrend
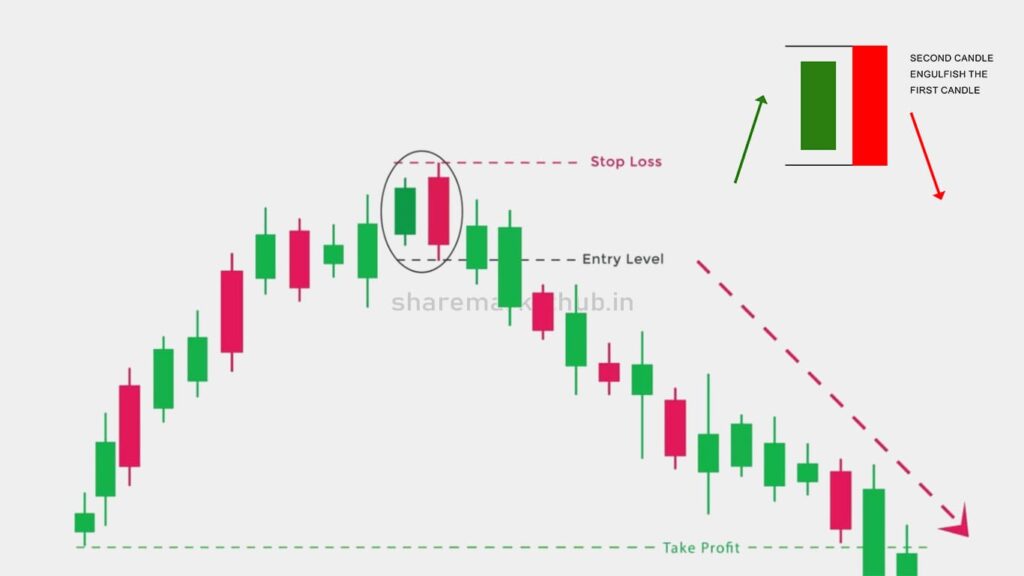
The Bearish Engulfing candlestick pattern is a technical analysis tool used to identify potential reversals in an uptrend. It is
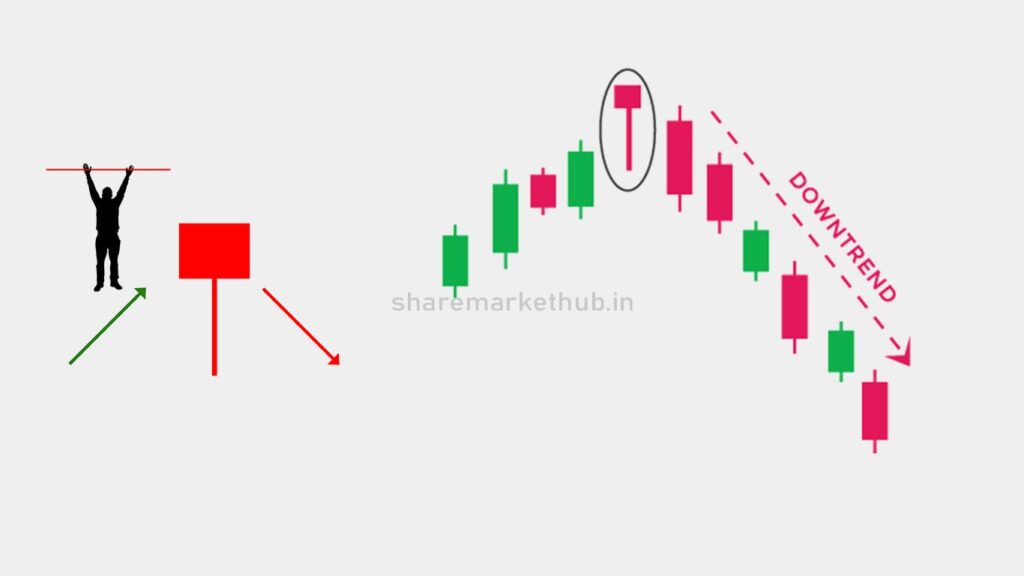
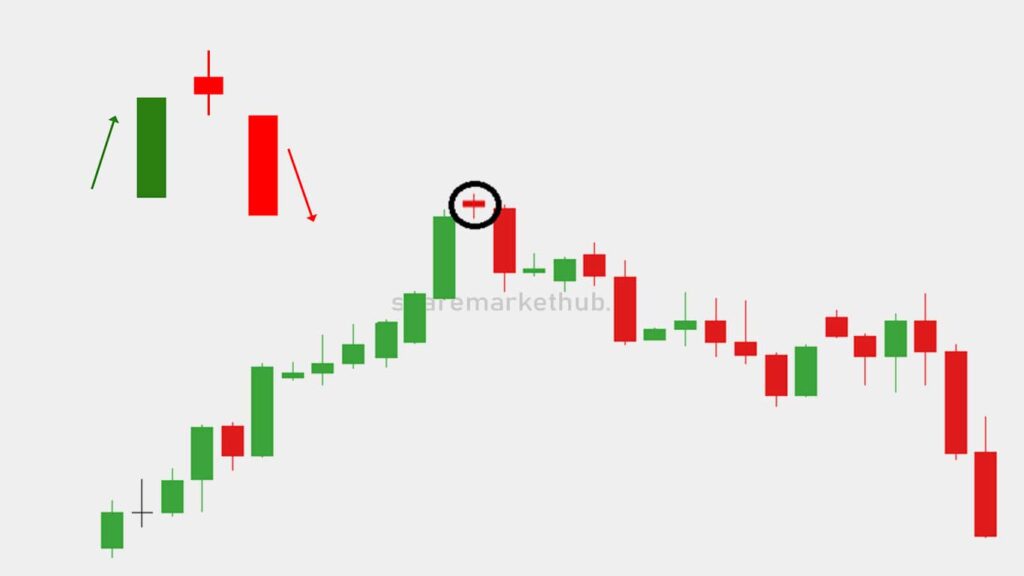
A Hanging Man candlestick pattern is a single candle formation that technical analysts use to identify potential reversals in an

The Inverted Hammer candlestick pattern is a bullish reversal pattern that typically forms at the bottom of a downtrend. It

The Bullish Harami candlestick pattern is a two-candle bullish reversal pattern that typically forms at the bottom of a downtrend.

The Three White Soldiers candlestick pattern is a bullish reversal pattern that typically forms after a downtrend, indicating a strong

The Morning Star candlestick pattern is a bullish reversal pattern that typically forms at the bottom of a downtrend. It
