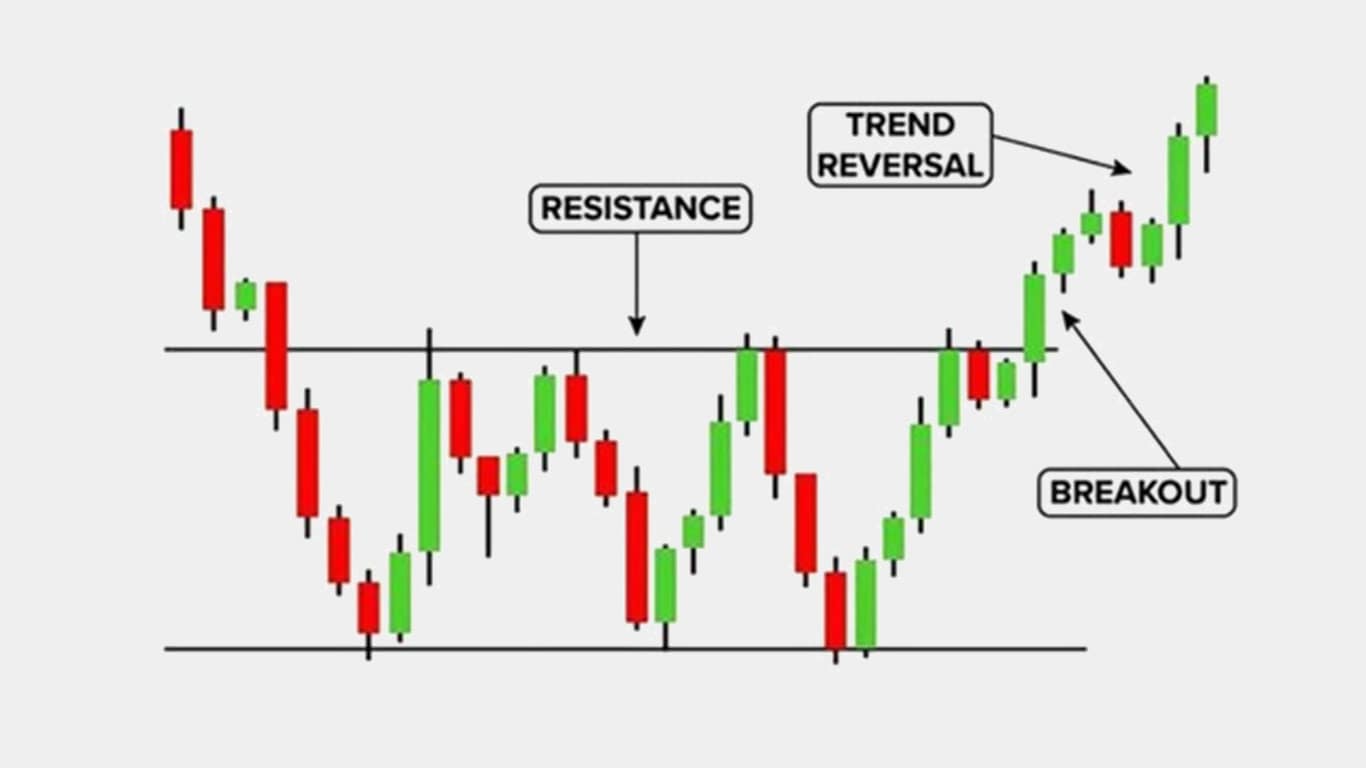
The triple bottom chart pattern is the opposite of the triple top pattern. It is a bullish reversal pattern that typically forms after a downtrend, signaling a potential trend reversal to the upside. Here’s how it usually unfolds:
Initial Downtrend: The price of an asset is in a downtrend, reaching a support level (first trough). After hitting this support, the price bounces but doesn’t rise significantly.
Second Test: The price again declines to the same support level (second trough), but fails to break through it, bouncing back again.
Third Test: The price makes a third downward move to the same support level (third trough), but again fails to break through it. This failure to breach the support level for the third time is significant.
Confirmation: After the third trough, the price starts to rise, breaking above the resistance level formed by the peaks between the troughs. This breach of resistance confirms the pattern.
Target: The expected price rise after the pattern confirmation is often estimated by measuring the distance from the support level to the peaks and adding it to the resistance level.
As with any technical analysis pattern, it’s essential to confirm the pattern with other indicators or analysis methods before making trading decisions. The triple bottom pattern, while bullish in nature, isn’t always a reliable signal on its own and should be used in conjunction with other forms of analysis for better accuracy.

ट्रिपल बॉटम चार्ट पैटर्न ट्रिपल टॉप पैटर्न के विपरीत है। यह एक तेजी से उलट पैटर्न है जो आम तौर पर डाउनट्रेंड के बाद बनता है, जो ऊपर की तरफ संभावित ट्रेंड रिवर्सल का संकेत देता है। यहां बताया गया है कि यह आमतौर पर कैसे सामने आता है:
- प्रारंभिक डाउनट्रेंड: किसी परिसंपत्ति की कीमत डाउनट्रेंड में है, समर्थन स्तर (पहला गर्त) तक पहुंच रही है। इस समर्थन पर पहुंचने के बाद, कीमत में उछाल आता है लेकिन उल्लेखनीय वृद्धि नहीं होती है।
- दूसरा परीक्षण: कीमत फिर से उसी समर्थन स्तर (दूसरी गर्त) तक गिर जाती है, लेकिन इसे तोड़ने में विफल रहती है, फिर से वापस उछलती है।
- तीसरा परीक्षण: कीमत उसी समर्थन स्तर (तीसरे गर्त) तक तीसरी बार नीचे की ओर बढ़ती है, लेकिन फिर से इसे तोड़ने में विफल रहती है। तीसरी बार समर्थन स्तर तोड़ने में यह विफलता महत्वपूर्ण है।
- पुष्टिकरण: तीसरे गर्त के बाद, कीमत बढ़ना शुरू हो जाती है, और गर्त के बीच की चोटियों से बने प्रतिरोध स्तर को तोड़ देती है। प्रतिरोध का यह उल्लंघन पैटर्न की पुष्टि करता है।
- लक्ष्य: पैटर्न की पुष्टि के बाद अपेक्षित मूल्य वृद्धि का अनुमान अक्सर समर्थन स्तर से शिखर तक की दूरी को मापकर और इसे प्रतिरोध स्तर में जोड़कर लगाया जाता है।
किसी भी तकनीकी विश्लेषण पैटर्न की तरह, व्यापारिक निर्णय लेने से पहले अन्य संकेतकों या विश्लेषण विधियों के साथ पैटर्न की पुष्टि करना आवश्यक है। ट्रिपल बॉटम पैटर्न, हालांकि प्रकृति में तेजी है, हमेशा अपने आप में एक विश्वसनीय संकेत नहीं होता है और बेहतर सटीकता के लिए विश्लेषण के अन्य रूपों के साथ संयोजन में इसका उपयोग किया जाना चाहिए।