The triple top chart pattern is a technical analysis pattern commonly observed in financial markets, especially in stock trading. It is considered a bearish reversal pattern and usually forms after an uptrend, signaling a potential trend reversal to the downside.
Here’s how it typically forms:
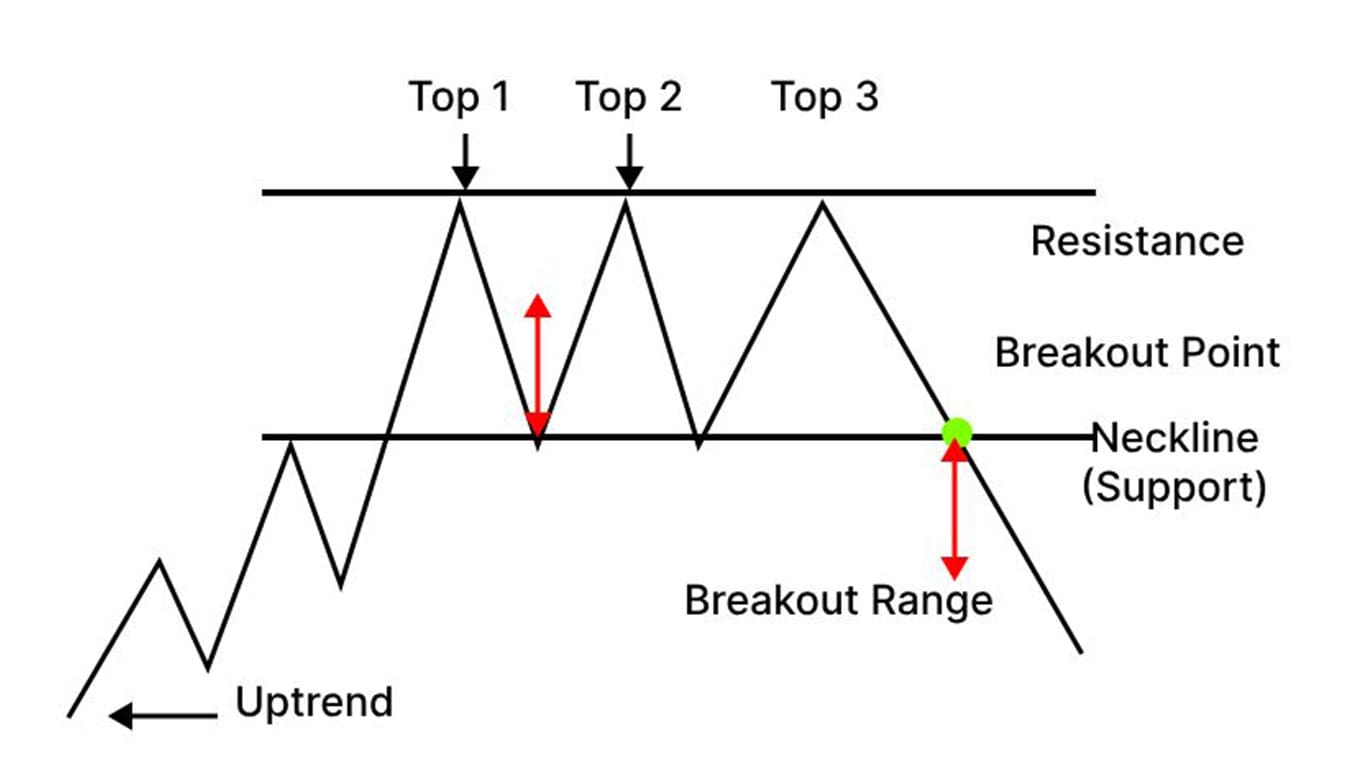
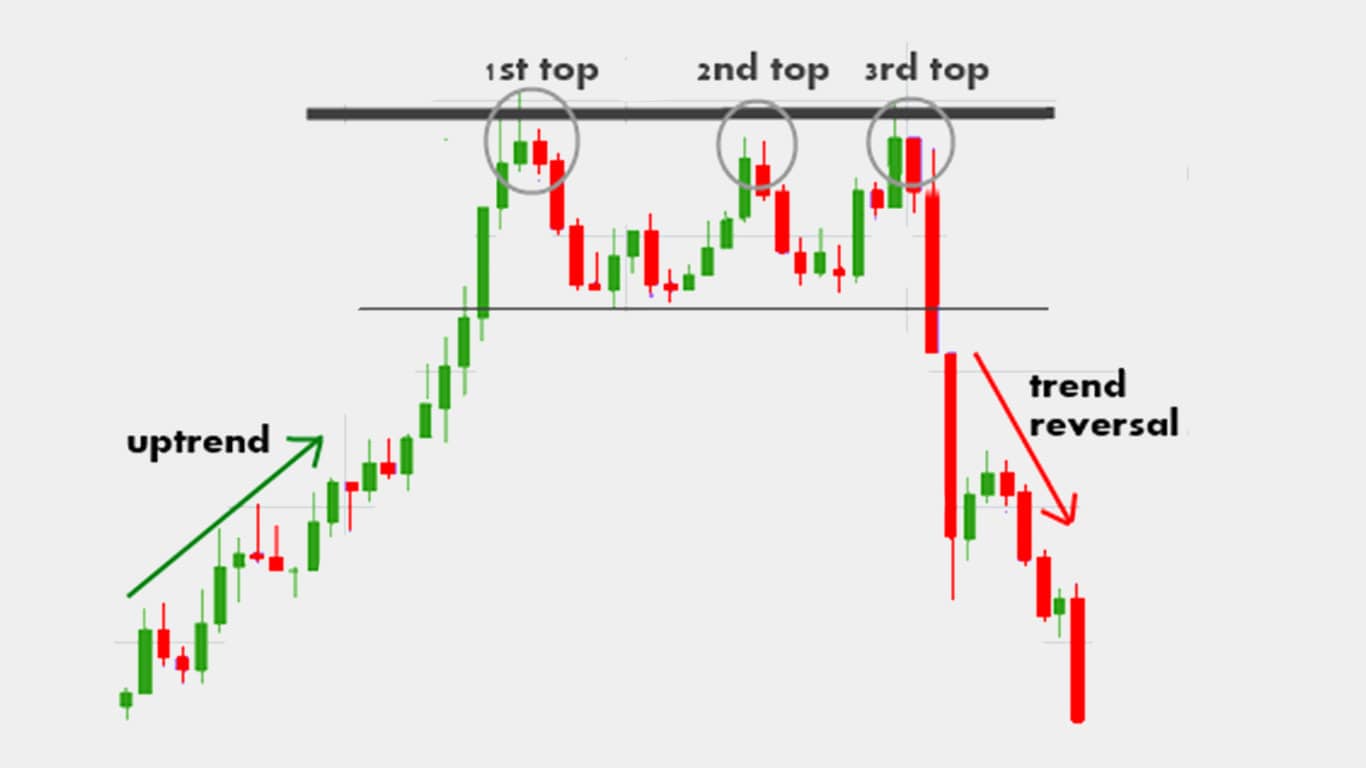
Initial Uptrend: The price of an asset is in an uptrend, reaching a resistance level (first peak). After hitting this resistance, the price retraces but doesn’t fall significantly.
Second Attempt: The price again rises to the same resistance level (second peak), but fails to break through it, retracing once more.
Third Attempt: The price makes a third upward move to the same resistance level (third peak), but again fails to surpass it. This failure to break through the resistance level for the third time is significant.
Confirmation: After the third peak, the price starts to decline, breaking below the support level formed by the troughs between the peaks. This breach of support confirms the pattern.
Target: The expected price decline after the pattern confirmation is often estimated by measuring the distance from the peak to the support level and subtracting it from the support level.
It’s essential to note that like any technical analysis pattern, the triple top pattern is not foolproof, and traders should use it in conjunction with other indicators and analysis methods to make informed decisions. Sometimes, what appears to be a triple top may turn out to be a trading range or other patterns upon further analysis. Therefore, it’s crucial to wait for confirmation before acting on the pattern.

ट्रिपल टॉप चार्ट पैटर्न एक तकनीकी विश्लेषण पैटर्न है जो आमतौर पर वित्तीय बाजारों में देखा जाता है, खासकर स्टॉक ट्रेडिंग में। इसे एक मंदी का उलटा पैटर्न माना जाता है और आमतौर पर यह एक अपट्रेंड के बाद बनता है, जो संभावित ट्रेंड के नीचे की ओर उलटने का संकेत देता है।
यहां बताया गया है कि यह आम तौर पर कैसे बनता है:
- प्रारंभिक अपट्रेंड: किसी परिसंपत्ति की कीमत एक अपट्रेंड में है, जो प्रतिरोध स्तर (पहले शिखर) पर पहुंच रही है। इस प्रतिरोध को मारने के बाद, कीमत पीछे हट जाती है लेकिन महत्वपूर्ण रूप से गिरती नहीं है।
- दूसरा प्रयास: कीमत फिर से उसी प्रतिरोध स्तर (दूसरे शिखर) तक बढ़ जाती है, लेकिन इसे तोड़ने में विफल रहती है, एक बार फिर पीछे हटती है।
- तीसरा प्रयास: कीमत उसी प्रतिरोध स्तर (तीसरे शिखर) तक तीसरी बार ऊपर की ओर बढ़ती है, लेकिन फिर से इसे पार करने में विफल रहती है। तीसरी बार प्रतिरोध स्तर को तोड़ने में यह विफलता महत्वपूर्ण है।
- पुष्टिकरण: तीसरे शिखर के बाद, कीमत में गिरावट शुरू हो जाती है, और शिखर के बीच के गर्त द्वारा बनाए गए समर्थन स्तर से नीचे गिर जाती है। समर्थन का यह उल्लंघन पैटर्न की पुष्टि करता है।
- लक्ष्य: पैटर्न की पुष्टि के बाद अपेक्षित मूल्य में गिरावट का अनुमान अक्सर शिखर से समर्थन स्तर तक की दूरी को मापकर और इसे समर्थन स्तर से घटाकर लगाया जाता है।
यह ध्यान रखना आवश्यक है कि किसी भी तकनीकी विश्लेषण पैटर्न की तरह, ट्रिपल टॉप पैटर्न फुलप्रूफ नहीं है, और व्यापारियों को सूचित निर्णय लेने के लिए अन्य संकेतकों और विश्लेषण विधियों के साथ इसका उपयोग करना चाहिए। कभी-कभी, जो ट्रिपल टॉप प्रतीत होता है वह आगे के विश्लेषण पर एक ट्रेडिंग रेंज या अन्य पैटर्न बन सकता है। इसलिए, पैटर्न पर कार्य करने से पहले पुष्टि की प्रतीक्षा करना महत्वपूर्ण है।